
The activities in this section are applicable for individuals aged 5-10.
Please note that some of the activities in this section may require adult supervision and assistance.
Table of Contents
- How Green are You?
- Shoe box Potato Maze
- Testing the pH of various substances
- A simple-to-make origami whale
- Workers Unite! Amazing Cells at Work
How Green are You?
Natural Resources Canada
What to do
Use this chart to track your daily efforts to conserve energy. Give yourself one point in the daily box for each activity that you complete. Record additional points for repeated activities. For example, if you turn the lights off three times in one day, give yourself three points in the daily box.
| What I did during Green Week | Mon | Tue | Wed | Thu | Fri | Sat | Sun |
|---|---|---|---|---|---|---|---|
| 1. Turned off lights when leaving a room. | |||||||
| 2. Let my hair air dry instead of blow dry. | |||||||
| 3. Turned off the tap while brushing my teeth. | |||||||
| 4. Turned off the television as soon as I finished watching a show. | |||||||
| 5. Walked, biked or took the bus to school. | |||||||
| 6. Decided what I wanted before opening the refrigerator door. | |||||||
| 7. Played outside with friends instead of on the computer. | |||||||
| 8. Had a fast shower instead of a big bath, using less water. | |||||||
| 9. Used the microwave instead of the oven. | |||||||
| 10. Re-used paper for school and home projects. | |||||||
| My total: |
Shoe box Potato Maze
Canadian Space Agency
Materials
- Sturdy shoe box with a tight fitting lid
- Sprouting potato
- Teacup
- Water
- Toothpicks
- Light baffles
- Foam padding or several pieces of felt
1. Planting the Potato
a. Place the potato in the tea cup and use toothpicks to hold the potato approximately one centimetre above the bottom of the tea cup.
b. Add water to the tea cup. Try not to spill or splash water in the shoe box since water will eventually cause the cardboard to disintegrate.
2. Installing the light baffles
a. Open the box and install three light baffles as shown in the next diagram.
b. It is essential that these baffles be absolutely light-tight along all edges and against the lid when it is fitted. If the baffles are glued in place their edges should be light-sealed with a couple of layers of black duct tape.
c. Finally, cut a circular hole in the end of the box to admit light into the interior
3. Installing the cover
a. It is important to prevent light from leaking over the top of the baffles where they come in contact with the lid. Two methods have proven useful:
i. Cut a thin sheet of foam padding to fit exactly inside the lid.
ii. Cut three or four thickness of heavy felt to fit exactly inside the lid.
b. Carefully install the lid and gently weigh it down so that it compresses the padding against the baffles and edges of the box.
4. Running the experiment
If the box is properly assembled, the only opportunity for light to enter the box is through the hole in the end of the box. Covering the box (leaving the hole exposed) with a black cloth provides additional protection from the effects of unwanted light entering.
5. Observations
This response is known as a phototropic response. The effect is called phototropism.
6. Explanation
The green leaves of some plants are very sensitive to light. These plants have evolved to spontaneously grow towards a source of light.
Testing the pH of various substances
Environment and Climate Change Canada
Try testing the following solutions with pH paper and record your results. If you have a computer available to use all the time, you may paste the chart into a word processing or spreadsheet program and record the results using the computer. If you have a printer, you can print out the following chart and fill it in by hand.
Materials
- Litmus paper
- Litmus paper reference chart
- 10 containers
- Soda water
- Diluted soda water solution (1 cup soda water and 1 cup tap water)
- White vinegar
- Diluted white vinegar solution (1 cup vinegar and 1 cup soda water)
- Milk
- Clear tea (no milk or sugar added)
- Orange juice
- Lemon juice
- Tomato juice
- Tap water
- Chart (see next page)
What to do
- Pour each sample into a separate container.
- Dip a piece of litmus paper into the first container.
- Compare the results of the litmus paper to that of the litmus paper reference chart.
- Record the pH levels in the chart (see next page).
- Repeat for each additional container.
Note: make sure to use a brand new piece of litmus paper for every sample.
| Solution | pH level |
|---|---|
| Soda water | |
| Soda water freshly opened and left to go flat for a day. Soda water is slightly sweetened water that has carbon dioxide dissolved into it under pressure. | |
| Soda water diluted by adding an equal volume of cold tap water. Here's an example: mix 1 cup (250 ml) soda water with 1 cup (250 ml) cold tap water. |
|
| Clear white vinegar | |
| Clear white vinegar diluted with an equal part of soda water. Here's an example: mix 1 cup (250 ml) white vinegar with 1 cup (250 ml) soda water. |
|
| Milk | |
| Clear tea (no milk or sugar added) | |
| Orange juice | |
| Lemon juice | |
| Tomato juice | |
| Tap water |
A simple-to-make origami whale
Fisheries and Oceans Canada
Materials
- Construction paper
- Scissors
- Markers or crayons
What to do
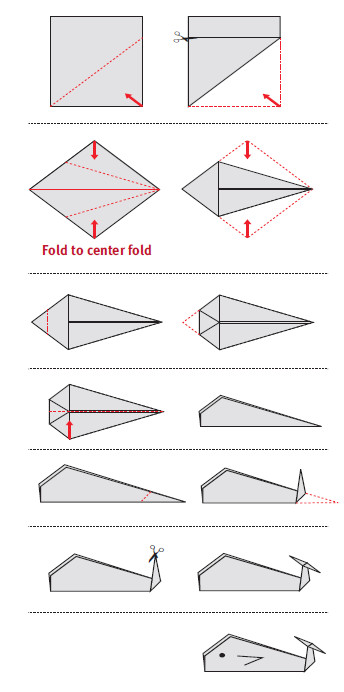
- Start by making a square piece of paper.
To start making the square, fold one corner of a piece of paper over to the adjacent side.
To finish making the square, cut off the small rectangle, forming a square (which is already folded into a triangle). - Fold two opposite sides over so that they meet at the fold.
- Fold the tip over to just meet the other folds.
- Fold the piece in half along the central axis.
- Fold the tail up.
- Make a short cut through the end of the fold in the tail. Fold the edges of the tail outwards.
- Draw eyes, fins, and any other patterns you like, and enjoy your whale.
Workers Unite! Amazing Cells at Work
National Research Council Canada
This experiment looks to locate and observe the vascular system in celery stems.
The vascular system transports water up the celery stem and into the leaves of the celery.
Materials
- A stalk of fresh celery
- A glass jar or bottle
- Red food colouring
- A sharp knife
- Magnifying glass
- Low power optical microscope (optional)
What to do
- To begin, acquire a stalk of fresh celery.
- Separate the stalk into individual celery stems.
- Using a sharp knife, make a clean slice across the bottom of the celery stems. You may leave the leaves of the celery on the top of the stem.
- Set a few of the celery stalks into a beaker or jar of clean tap water.
- Place an ample amount of red food colour dye into the water so that it is tinted a deep red colour.
- Set the beaker in a warm bright location and observe any changes in the celery stalks and their leaves for a period of several days.
- In a very short time (as little as a few hours) red dots begin to appear in the celery leaves. At first the leaves may begin to wilt. Left in the red water for a few days they will become much redder in colour. You will also notice that red lines will begin to form on the stems.
- Very carefully, and with a sharp knife, cut a thin slice from the lower part of the coloured celery.
- Making a bias cut (diagonally) through the stem improves the visibility of the vascular bundles that have become coloured red with dye.
- Using either a magnifying glass (or a microscope on low power) make a simple sketch of the stem's cross-section showing the location of the vascular bundles in the stem.
- Try repeating this activity using food dyes of other colours such as blue or yellow. Notes: To view the stem cross-section with a microscope the slice should be as thin as possible.
- Given sufficient time to absorb the dye the leaves of the celery will become almost entirely red.
- Adding dyes of different colours to biological specimens is a common technique used by scientists to help them visualize the structures and processes which occur in various organisms.
Discussion
- Examine the diagram that you have made of your celery stem.
- Where, in relation to the ridges that run up and down outside of the celery stem, are the vascular bundles located?
- Are the vascular bundles located nearest to the inside or outside of the stem? Can you suggest a reason for their location?
- The vascular system of the plant transports vital water and the dissolved materials it contains to cells throughout the plant. What do the living cells of the vascular system get in return from the rest of the plant?